

Unlocking Sales Insights with Salesforce and Power BI
December 29, 2023
Salesforce is a powerful Customer Relationship Management (CRM) platform that empowers organizations to streamline every aspect of the customer journey. It provides tools for managing leads, opportunities, and customer accounts, among many other functions. Despite there being vast amounts of data within Salesforce, it can be difficult to transform it into actionable insights. This is why integrating Salesforce with Power BI can be a game-changing move for your organization. In this blog, we will discuss the steps involved in transforming your Salesforce data into actionable insights with Power BI – including how to integrate Salesforce with Power BI, how to build your data model, as well as provide example visualizations you can use to drive sales insights.
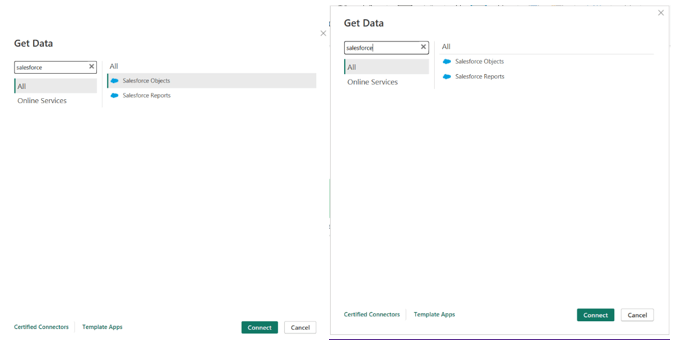
Getting Started with Salesforce and Power BI Integration: The first step is to connect Salesforce with Power BI. Salesforce offers a connector to Power BI that simplifies the process of importing your data into Power BI for in-depth analysis. You will need a Salesforce account and your credentials to connect.
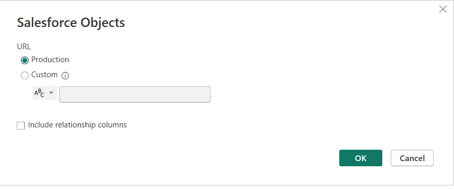
Next, you can provide a custom URL for non-production data or connect directly to Production data.
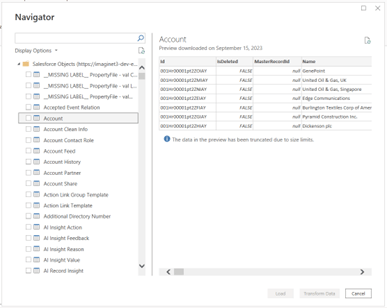
Lastly, after providing Salesforce login credentials as required, you will be able to see your Salesforce objects.
Data Transformation with Power Query:
The next step is to cleanse and transform the data in Power Query. Salesforce data is stored in tables called objects. Examples of Salesforce objects include Opportunities, Cases, and Accounts.
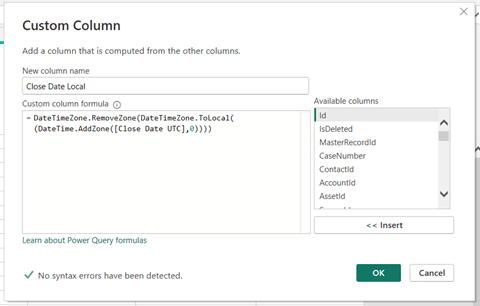
As you begin pulling data into Power Query, it’s essential to take the following into consideration. First, Salesforce stores timestamps in UTC, so you might consider converting the dates and times to your local time zone, if applicable. To achieve this, you can use a combination of the DateTime.AddZone and DateTimeZone.ToLocal functions in M code. The DateTime.AddZone function adds timezone information to a datetime column. The second parameter of the DateTime.AddZone function is the time zone offset from UTC time, so if your column is already in UTC time then this parameter should be zero. After adding the timezone information, you can convert to local time using the DateTimeZone.ToLocal function. Also, to get your column back to datetime format, you can use the DateTimeZone.RemoveZone function.
Additionally, if your organization stores data in datetime format, to optimize your data model and ensure efficient analysis, consider splitting these timestamps into separate date and time columns or converting them to date types if time precision is unnecessary. When Power BI has a column that contains datetime (perhaps to the millisecond precision) and a lot of rows, that column becomes very expensive and consumes a lot of memory. Splitting a datetime column into two separate columns can save a lot of memory and make it much easier to work with a date table. Consider also reducing the precision of the time (if you need time at all) to eliminate milliseconds, seconds, or even minutes or groups of minutes (5, 10, 15, 20 or 30 minute intervals).
Salesforce also allows you to create custom objects and custom columns within existing objects. This functionality permits you to tailor your data to align perfectly with your organization’s specific needs and requirements. Moreover, when custom objects and columns are strategically incorporated into Power BI reports and dashboards, they can unveil deeper insights into your business processes. Custom columns are suffixed with ___c, as shown in the Account object below:
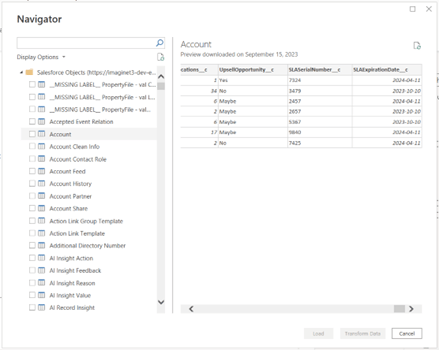
UpsellOpportunity, SLASerialNumber, and SLAExpirationDate are examples of unique columns that can be added by your organization within Salesforce to customize data to your needs.
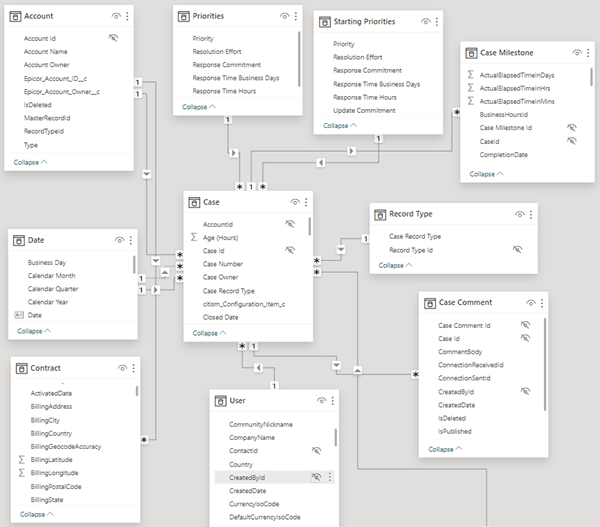
Building Relationships:
Once your data goes through the transformation process, you can load it into your model. It’s important to note Salesforce often has complex relationships between its objects. To ensure your analysis is accurate, understand your data and build the correct relationships between these objects. Below is an example of what your data model may look like.
Unlocking Sales Insights with Visualizations:
Let’s delve into the power of visualizations. Below are three visualizations that can provide invaluable sales insights that will help your business thrive:
1. Lead Source Analysis Visual:
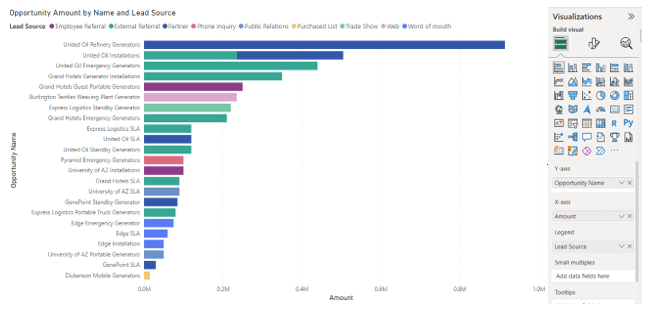
This visual utilizes the opportunities object in Salesforce which manages key information related to sales opportunities. The bars show how different lead sources contribute to each opportunity.
Insights: With this column chart, you can identify which sources contribute the most to your sales pipeline. This information can help allocate marketing resources more effectively, optimizing your lead generation strategies. From this visual, we can see that External Referrals contribute highly to the sales pipeline.
2. Industry Analysis Visual:
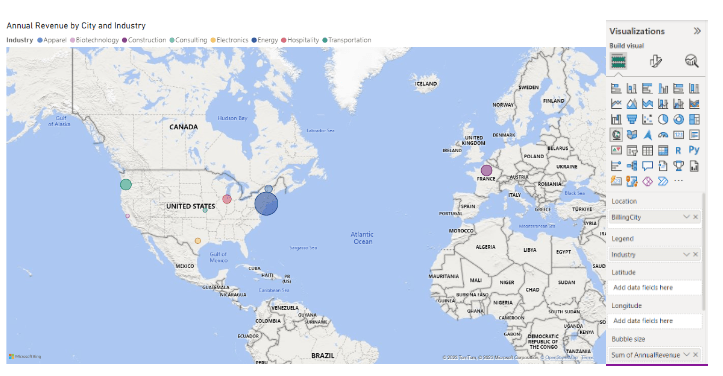
This visual utilizes the accounts object in Salesforce which holds all the information about your customer accounts. The colours of the bubbles indicate the account industry and the size of the bubbles corresponds to annual revenue.
Insights: This visualization unveils which industries are the primary revenue drivers for your business, aiding strategic decision-making. From this visual we can see that the energy industry has the highest revenue and is centralized to the northeastern sector of the United States.
3. Main Competitor Analysis Visual:
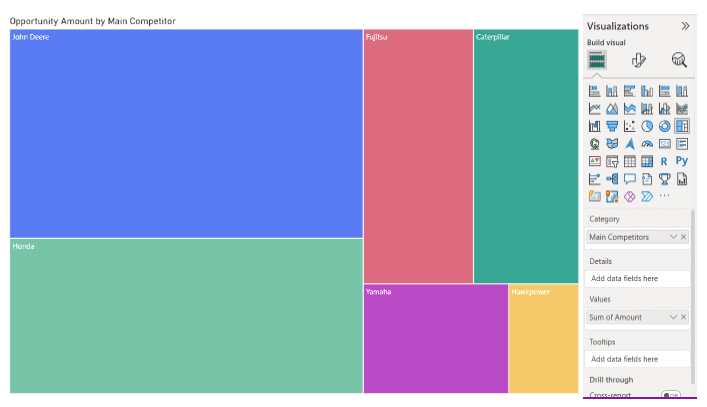
This visual again uses the opportunities object and specifically uses a custom field called Main Competitors. This field is not part of Salesforce’s default setup, but with Salesforce’s ability to create custom objects and fields, you can easily define it to provide data on who your competitors are. This type of visual is called a treemap, where the size of each rectangle corresponds to the opportunity amount attributed to different competitors.
Insights: This visualization helps pinpoint which competitors you might be losing opportunities to. You can then conduct competitor analysis and reassess sales strategies to better prepare for sales opportunities in the future.
Integrating Salesforce with Power BI can be a powerful tool if used correctly. It can unlock access to data previously unavailable, leading to more impactful business decisions. We highly recommend integration and taking advantage of the data and its potential applications.
Follow our blog and subscribe to our newsletter to keep up to date with any changes. If you are looking for specific help with designing and building your Power BI reports, contact us directly to discuss.

Discover More

SQL Saturday Part 2: Learning About Microsoft Fabric
SQL Saturday Part 2: Learning About Microsoft Fabric February 29, 2024 I’ve been digging into Microsoft Fabric recently – well overdue, since it was first released about a year ago.…

My Trip to SQL Saturday Atlanta (BI Edition): Part 1
My Trip to SQL Saturday Atlanta (BI Edition): Part 1 February 23, 2024 Recently, I had the opportunity to attend SQL Saturday Atlanta (BI edition), a free annual event for…

Enabling BitLocker Encryption with Microsoft Intune
Enabling BitLocker Encryption with Microsoft Intune February 15, 2024 In today’s data-driven world, safeguarding sensitive information is paramount, especially with the increase in remote work following the pandemic and the…

Let’s build something amazing together
From concept to handoff, we’d love to learn more about what you are working on.
Send us a message below or call us at 1-800-989-6022.